On this page, you can see the summary of the eBMS database and Butterfly Indicators
On the eBMS Data Summary you can navigate through the different tabs on the menu or on the following links to discover more information:
- Explore online data: visualise all the monitoring uploaded to the online eBMS portal
- eBMS database: description of the database and how to submit data
- eBMS mobile application: ButterflyCount app description for Android and iOS
- Data access policies: request for data
The eBMS in numbers (1990 - 2024) eBMS v7
The latest version available is eBMS v7. This version includes data from 35 schemes, from 30 different countries in Europe. When considered at the section level, the eBMS database v7 contains more than 16 million counts recorded in 29 countries spanning over 45 years (1976 to 2024). ![]()
We have received data from 35 Butterfly Monitoring Schemes that actively contribute their data to the eBMS database and website. Although not all schemes were in a position to provide their latest update for 2019-2021 (see figure), butterfly monitoring data for Europe continues to increase year-on-year.
Since 1990, more than 10,000 recorders and volunteers have counted more than 15 million butterfly count events along transects and documented them at the species level. These counts have been recorded from over almost 1 million monitoring events (e.g. BMS transect visits).
Since 1990:
- 19 million counts
- 1,369,613 million visits
- 16,152 transects
- 51,340 km monitored in transects
- 368 species monitored of the 496 species observed in Europe
- 35 schemes across 30 Countries
Map: The density of Butterfly Monitoring transects visited per 50km grid across all schemes that have contributed to the eBMS database (as of v7.0). Densities are calculated from sites that have been visited at least once from 1990 to 2024.
Transect Graph: a) Number of Butterfly Monitoring transects in the database of eBMS (1990-2024), where schemes within EU27 are represented in dark blue and non-EU schemes in light blue. b) Number of Schemes on the eBMS database across EU27 member states, lighter color for countries outside the EU27.
Taxonomy
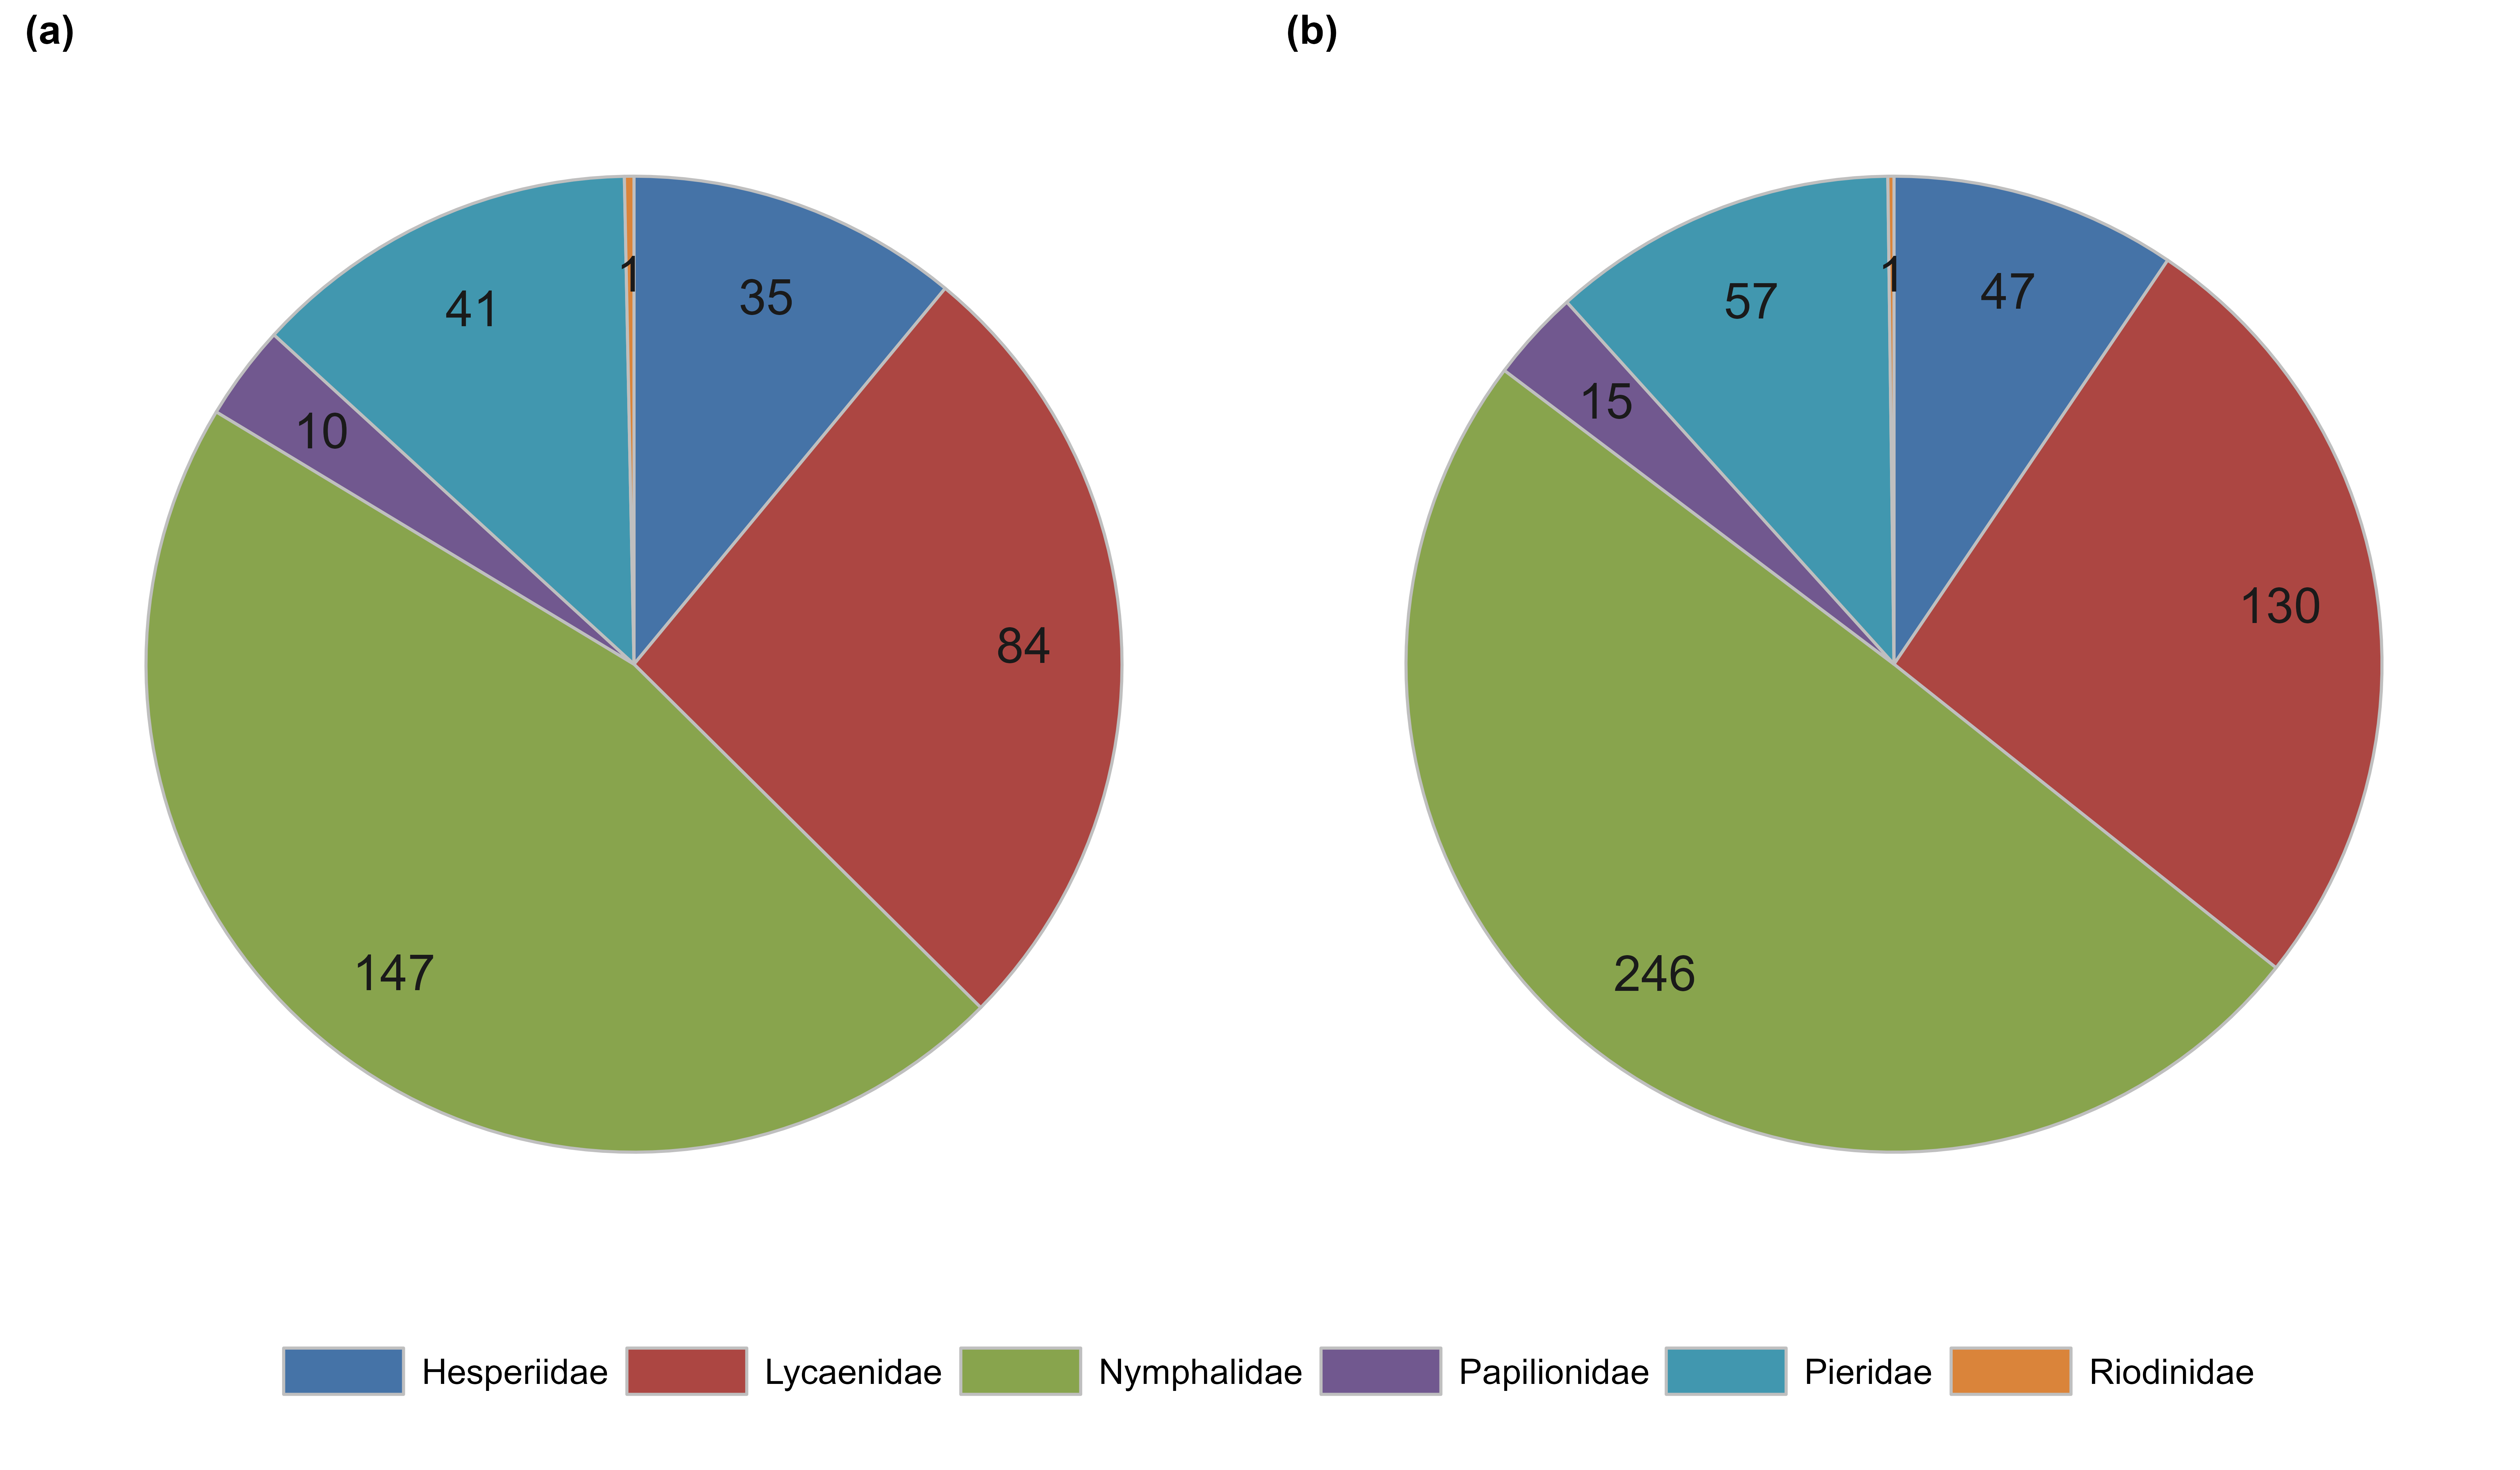
The eBMS data has increased recently with the joining of several schemes and the creation of new schemes providing more data and transects. As of today (2024), the army of skilled volunteers has identified and recorded 368 of the 496 species observed on the European continent (Wiemers et al. 2019). Although the protocol and the extent of the BMS contributing to the eBMS database do not capture all species, the species monitored are proportionally representative of their distribution among families and the phylogenetic tree
Data up to 2020
In the pie graphs below, you can see the taxonomy covered by eBMS (1990-2020). The number of butterfly species by family with data included (a) within the European Butterfly Monitoring Scheme (eBMS) database and, (b) for the whole of Europe (Wiemers et al. 20193).
Butterfly Indicators

Some of the EU biodiversity indicators provide specific measurements and trends on genetic, species, and ecosystem/landscape diversity, but many have a more indirect link to biodiversity. Very few have been explicitly established to assess biodiversity. The status indicators on species only cover birds, bats, and butterflies, since these are the only taxa/species groups for which reasonably harmonized European monitoring data are available (EEA, 2012).
Butterflies are ideal biological indicators: they are well-documented, measurable, sensitive to environmental change, occur in a wide range of habitat types, represent many other insects, and are popular with the public because of their beauty. Field monitoring is essential to assess changes in their abundance. Indicators based on butterfly monitoring data are valuable to understanding the state of the environment and help evaluate policy and implementation. Trained volunteers are a cost-effective way of gathering robust data on butterflies, more so when supported by informative materials and efficient online recording.
The butterfly indicators are based on the fieldwork of thousands of trained professional and volunteer recorders, counting butterflies on more than 10,000 transects scattered widely across Europe. These counts are made under standardised conditions, providing high-quality data that are suitable to assess species status and trends. National coordinators collect the data and perform the first quality control. More information on the Method page.
Grassland Butterfly Indicator
European butterfly experts selected species they considered to be characteristic of European grassland and which occurred in a large part of European Europe, to create the Grassland Butterfly Indicator. This first butterfly indicator was created in 2005 for the first time as a unified measure of biodiversity following the bird indicators as described by Gregory et al. (2005), by averaging indices of species rather than abundances to give each species an equal weight in the resulting indicators.
Technical Report EU Grassland Butterfly Index 1991 - 2024
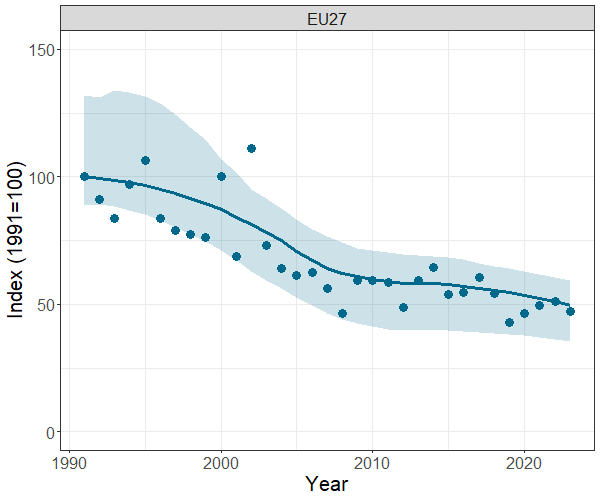
The big database of eBMS provides trends on individual butterfly species, which can be combined to give trends for different habitats. In the report, trends for 17 species have been used to generate an updated Grassland Butterfly Index (GBI) for 1991-2024, using data from all 27 EU countries.
The EU Grassland Butterfly Index 1991-2024 shows a decline of 47% since 1991. The decline observed over the last 34 years likely reveals only part of the historical decline in grassland butterflies, as many populations were extirpated from the landscape before 1990. This report provides an essential message from scientists to policymakers - that butterflies are still declining at an alarming rate across the EU and that urgent action is required to protect and restore habitats to reverse this trend, not only for butterflies but also for other wild insect pollinators and their ecosystem services.
Technical Report EU Grassland Butterfly Index 1991 - 2023
We are pleased to inform you that we have updated the EU Butterfly Indicator for Grassland species, 1991-2023. We produced a technical report to describe the indicator, it represents a major update with the last three years up to 2023, through the incorporation of more and expanded datasets, schemes and the 27 EU countries (6,000 transects, and 17 species). It is the first major output from the EMBRACE project.
The EU Grassland Butterfly Index (GBI) 1991-2023 indicator is part of the monitoring report on progress towards the SDGs (Sustainable Development Goals) in an EU context. The grassland butterfly indicator contributes to Goal 15: Life on Land being; one of the two biodiversity indicators together with birds. The GBI is specifically mentioned in the EU Nature Restoration Regulation (NRR) in article 11 on the Restoration of Agricultural ecosystems as one of the possible indicators.
Technical Report EU Butterfly Grassland Index 1990 - 2020
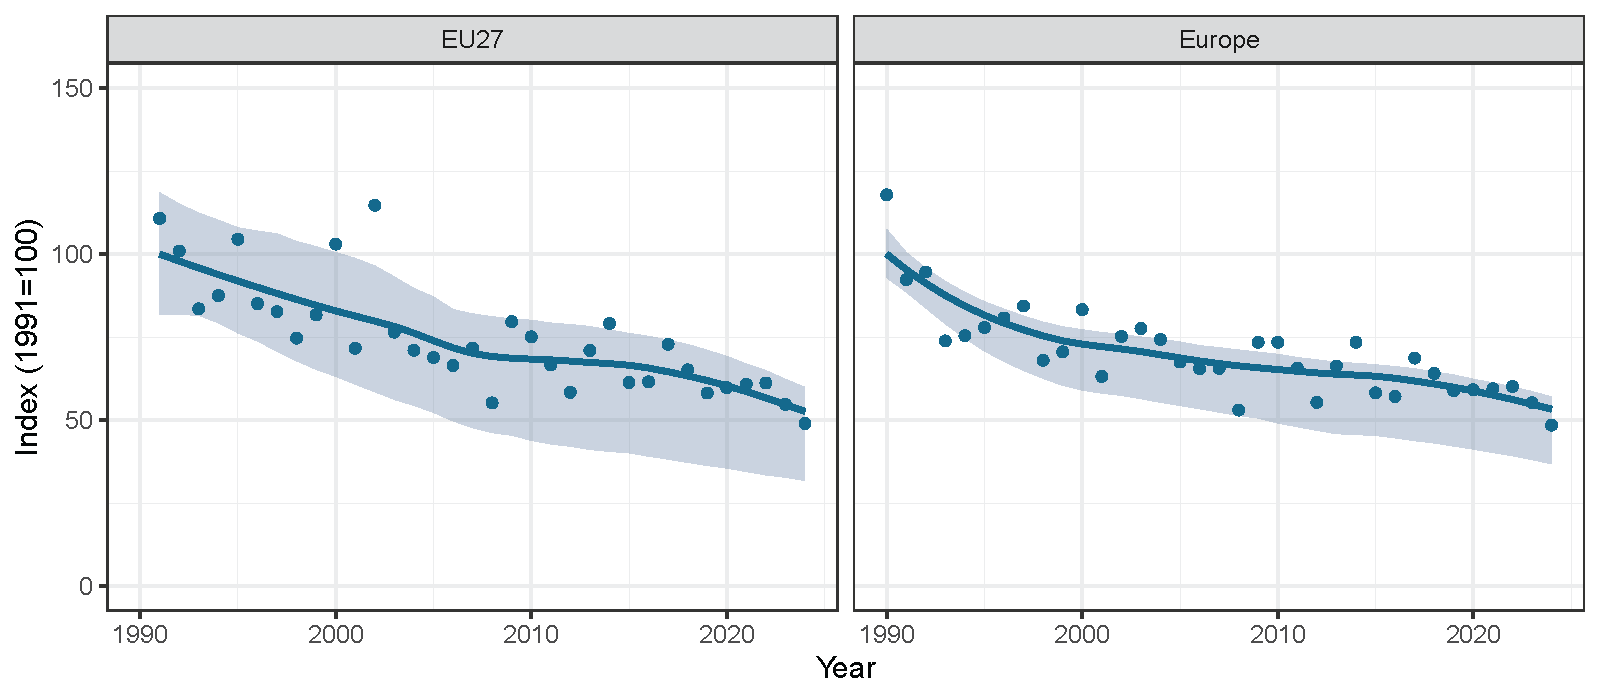
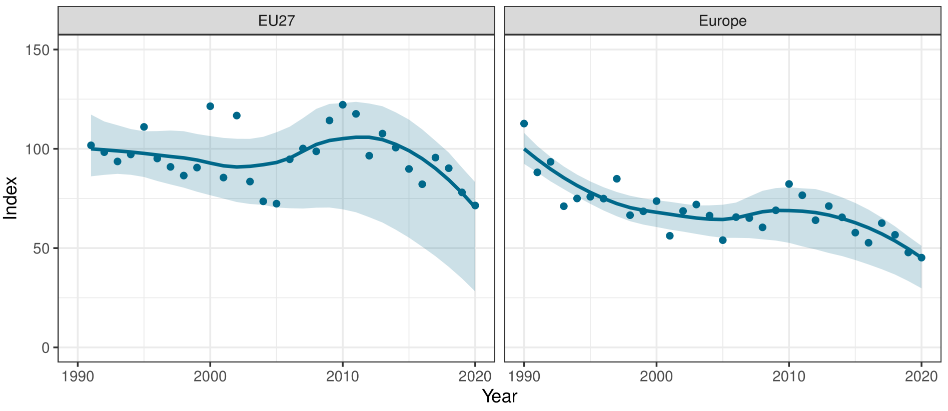
The updated EU Grassland Butterfly Indicator 1990-2020 is the combined population trend of 17 selected grassland species monitored across Europe for a long period of time. The indicator has been calculated from population trends estimated for the whole European region and restricted to the 27 EU Member States. In the last ten years, the indicator shows a linear decline of 32% in the EU27 and 36% in Europe up to 2020 with the last update of the eBMS database.
The graphs show the European Grassland Butterfly Indicator 2020 for EU27 and Europe. Shaded areas represent 95% confidence intervals.
Technical Report EU Butterfly Grassland Index 1990 - 2017
The updated EU Butterfly Indicator for Grassland species, 1990-2017. We produced a technical report to describe the indicator, it represents a major update on previous versions, through the incorporation of more and expanded datasets, together with new analysis techniques. It is the first major output of the Assessing ButterfLies in Europe (ABLE) project.
For both indicators, the 2020 value is significantly lower than the start value of the indicator. In the last ten years, the indicator shows a linear decline of 32% in the EU27 and 36% in Europe. Due to the filtering by the minimum number of Butterfly Monitoring Schemes (BMS), the Grassland Butterfly Indicator for the EU27 starts one year later than the European one (Figure below). For the EU27 there is a greater uncertainty in the yearly estimates for this indicator due to less data included. Compared to previous Grassland Butterfly Indicators the United Kingdom is now not represented in the EU27 indicator anymore, resulting in large confidence intervals.
To discover more indicators produced by eBMS and how the indicators were calculated, please check the ABLE Report Task 1 - Butterfly Indicators (pdf in English)
Explanations of the methods and calculations are on the Output page: https://butterfly-monitoring.net/ebms-outputs