On this page you can find:
- Webinar
- Publications
- Statistic tools
- eBMS newsletters
1.Webinar on Butterfly Monitoring and Grassland Butterfly Indicator (GBI)
Webinar for EU Member State Biodiversity and Pollinator policy makers and officials. Presentations:
- Chris van Swaay, Introduction; Reto Schmucki, GBI explanations and Cristina G. Sevilleja, Cost-effectiveness eBMS network
- Video of the recording session
2.Publications:
Technical Report EU Grassland Butterfly Index
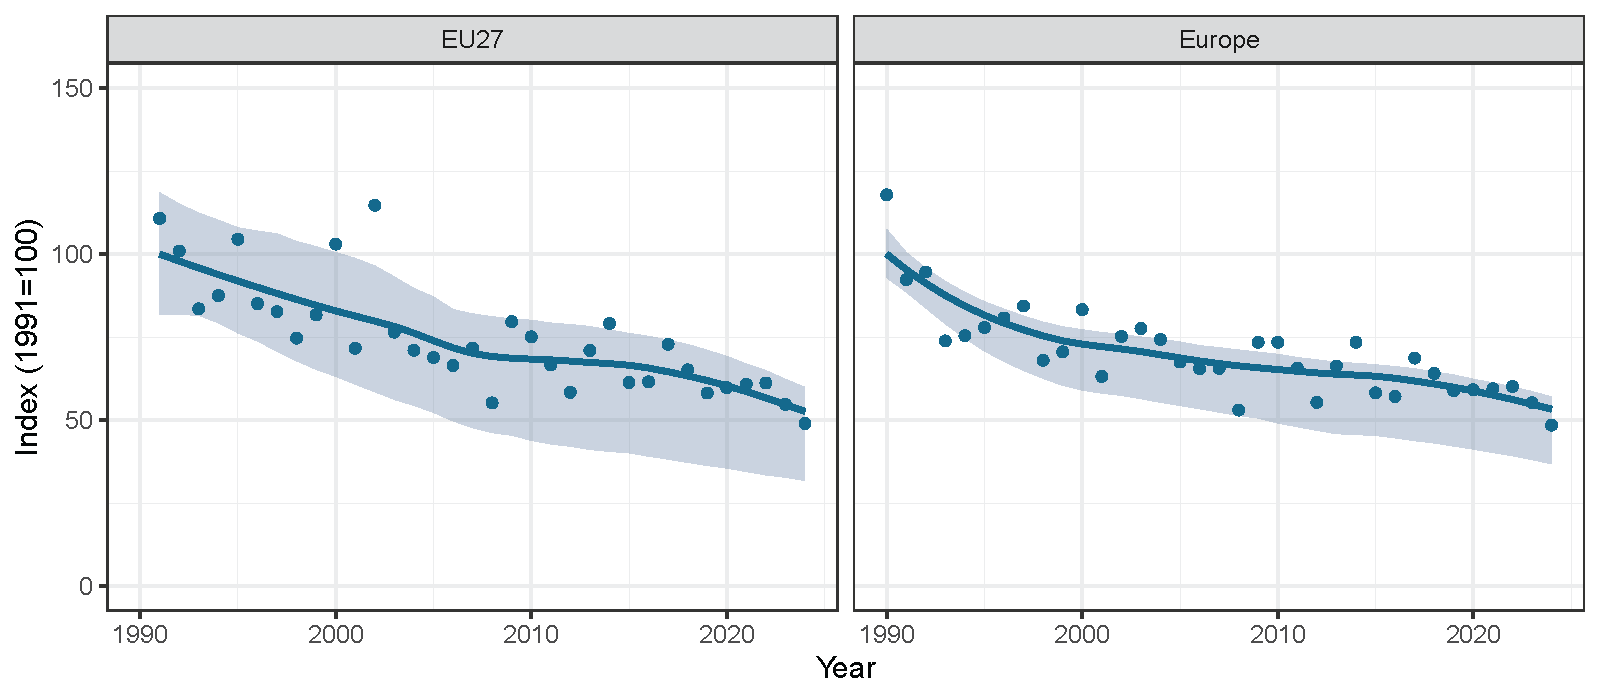
eBMS produced a technical report to describe the indicator from the National BMSs integrated into the central database of eBMS. This big database provides trends on individual butterfly species, which can be combined to give trends for different habitats. In the report, trends for 17 species have been used to generate an updated Grassland Butterfly Index (GBI) for 1991-2024, using data from all 27 EU countries.
The EU Grassland Butterfly Index shows a decline of 47% since 1991. The decline observed over the last 34 years likely reveals only part of the historical decline in grassland butterflies, as many populations were extirpated from the landscape before 1990. This report provides an essential message from scientists to policymakers - that butterflies are still declining at an alarming rate across the EU and that urgent action is required to protect and restore habitats to reverse this trend, not only for butterflies but also for other wild insect pollinators and their ecosystem services.
Policy involvement of GBI: The EU Grassland Butterfly Index (GBI) is the indicator on the EU Dashboard Target 5 for evaluating progress with improving agroecosystems for biodiversity. The GBI is part of the monitoring report on progress towards the SDGs (Sustainable Development Goals) in an EU context. The grassland butterfly indicator contributes to Goal 15: Life on Land being; one of the two biodiversity indicators together with birds. The GBI is specifically mentioned in the EU Nature Restoration Regulation (NRR) in article 11 on the Restoration of Agricultural ecosystems as one of the possible indicators.
Technical Report EU Grassland Butterfly Index (GBI) for 1991-2024 pdf
Previous GBIs produced:
- Technical Report EU Butterfly Indicator for Grassland species, 1991-2023. EMBRACE project. Spanish version
- Technical Report EU Grassland Butterfly Indicator 1990-2020 EMBRACE project.
- Technical Report EU Butterfly Indicator for Grassland species 1990-2017 (ABLE) project.
- Technical Reports ABLE project.
All produced results during the European project ABLE between 2018-2020.
- Executive Summary (pdf in English)
- Report Task 1 - Butterfly Indicators (pdf in English)
- Report Task 2 - Network Development (pdf in English)
- Report Task 3 - Tools (pdf in English)
- ABLE Policy Brief (pdf in English), Resumen (Spanish), Sommario (Italian)
This would not have been possible without the effort of all the collaborators, national schemes and volunteers that provide the data. Our appreciation to all of them
3.Statistic tools
Workshop 'Calculating butterfly trends, indexes and indicators'
In the ABLE project new tools have been developed to make it easier for regional and national coordinators of Butterfly Monitoring Schemes to calculate indexes and trends as well as build indicators. This workshop focuses on the background of the method and learning how to use the tools.
Preparation:
 Install the latest version of R.
- Install the latest version of RStudio.
- Install Rtools, not a package but some updated tools for windows, from https://cran.r-project.org/bin/windows/Rtools/
- Then open R, and install:
- install.packages("devtools")
- install.packages("sf")
- install.packages("data.table")
- install.packages("speedglm")
- install.packages("ggplot2")
- install.packages("mapview")
- Then do: library(devtools) and then:
- devtools::install_github("RetoSchmucki/rbms")
- devtools::install_github(repo = 'biologicalrecordscentre/BRCindicators')
Workshop website
Go to https://butterfly-monitoring.github.io/bms_workshop/ and find all necessary information, including the full R-code and an explanation.
All presentations (including a transcript) are available at:
- Link video explanation WK1: BMS and count data in R, data wrangling and mapping (Reto Schmucki)
- Link video explanation WK2: Modelling Butterfly Abundance (GAI and rbms package) (Emily Dennis & Reto Schmucki)
rbms (R package)
22 functions to interact and analyse BMS data.
You can find more information of the package in this link: https://retoschmucki.github.io/rbms Also more information in tutorials and web resources in https://butterfly monitoring.github.io/bms_workshop/
4.eBMS Newsletters
Newsletter sections: Summary 15min Counts, SPRING Results, ButterflyCount app, EU Policy update
Newsletter sections: updates eBMS Network, eBMS tools, Recent events, Spring project, and Policy Brief ABLE
ABLE Newsletter 2020 - June
Link to the online Newsletter 2020 or download the pdf
ABLE Newsletter 2019
The first Newsletter of the ABLE project was produced in October 2019. In this first release, you can see all the results from one year of work of the ABLE project: how the eBMS network grew in one year, an interview with one of the New Coordinators, access to new monitoring materials for volunteers, and more information about the ABLE results.
Link to the online Newsletter or download the pdf